|
OrzDBA是淘宝DBA团队发布的监控脚本,它使用perl开发并能完成对linux系统和MySql相关指标的实时监控,本文将介绍在CentOS下安装OrzDBA的方法。 MYSQL这些监控指标的来源和mysqlreport等工具类似,都是通过show variables列出经常关注的核心变量,通过show global status列出相关MYSQL状态信息。这个监控工具比较有特色,把系统信息和数据库信息一起监控,就是安装有点麻烦。 项目地址。
安装 使用SVN下载OrzDBA的项目,其中包含了文档和依赖的包文件。 1.下载源码 $ svn co http://code.taobao.org/svn/orzdba/trunk $ chmod +x orzdba $ cp orzdba /usr/bin/orzdba 2.安装tcprstat orzdba依赖于tcprstat,需先安装tcprstat。 $ wget http://github.com/downloads/Lowercases/tcprstat/tcprstat-static.v0.3.1.x86_64 $ cp tcprstat-static.v0.3.1.x86_64 /usr/bin/tcprstat $ chmod u+sx /usr/bin/tcprstat 3.编辑orzdba源码 在源码162行左右把/usr/bin/tcprstat加入默认读取的位置 运行:$ vim orzdba my $TCPRSTAT = "/usr/bin/tcprstat --no-header -t 1 -n 0 -p $port"; 4.安装的perl依赖包 $ yum install perl-Test-Simple.x86_64 perl-Time-HiRes perl-ExtUtils-CBuilder perl-ExtUtils-MakeMaker perl-DBD-MySQL perl-DBI 5.安装version模块 $ wget http://search.cpan.org/CPAN/authors/id/J/JP/JPEACOCK/version-0.99.tar.gz $ tar -zxvf version-0.99.tar.gz $ cd version-0.99 $ perl Makefile.PL $ make $ make test $ make install 6.安装Module-Build模块 $ wget http://search.cpan.org/CPAN/authors/id/K/KW/KWILLIAMS/Module-Build-0.31.tar.gz $ tar -zxvf Module-Build-0.31.tar.gz $ cd Module-Build-0.31 $ perl Build.PL $ ./Build $ ./Build test $ ./Build install 7.安装File::Lockfile模块 $ wget http://search.cpan.org/CPAN/authors/id/G/GL/GLORYBOX/File-Lockfile-v1.0.5.tar.gz $ tar -zxvf File-Lockfile-v1.0.5.tar.gz $ cd File-Lockfile-v1.0.5 $ perl Build.PL $ perl ./Build $ perl ./Build test $ perl ./Build install 8.安装Class-Data-Inheritable模块 $ wget http://search.cpan.org/CPAN/authors/id/T/TM/TMTM/Class-Data-Inheritable-0.08.tar.gz $ tar -zxvf Class-Data-Inheritable-0.08.tar.gz $ cd Class-Data-Inheritable-0.08 $ perl Makefile.PL $ make $ make test $ make install 安装完如提示:Usage: Socket::inet_ntoa(ip_address_sv) at ./orz line 477,因主机名不能解析,需要将IP和主机名写到/etc/hosts文件。 $ vi /etc/hosts 127.0.0.1 mike 注:SVN中签出包含一个orzdba_rt_depend_perl_module.tar.gz文件,这个文件也包含以上4个PERL模块的源代码。
配置 1.配置登陆密码 在代码的160行左右,配置自己的MySQL验证信息:username、password、socket、host、port 针对MYSQL 5.6以下版本: $ grep -n 'my $MYSQL' orzdba 160:my $MYSQL = qq{mysql -s --skip-column-names -uroot -pyoon -h127.0.0.1 -P$port }; 针对MYSQL 5.6以上版本: 密码安全问题解决。 $ mysql -uroot -p'xxxxx' -s Warning: Using a password on the command line interface can be insecure. (db)root@localhost [(none)]> MySQL加强了密码安全,如果在命令行输入密码,会出现这个警告。但这个警告会影响orzdba展示页面,解决这个烦人的警告可以通过下面两个方法: 1].把数据库密码写到my.cnf配置文件里面 2].同样利用mysql5.6的新特性mysql_config_edit可以用来加密用户的密码,消除警告(推荐) $ mysql_config_editor set --login-path=login --user=root --password $ mysql_config_editor print --all [login] user = root password = ***** host = localhost #加密过后的文件是二进制文件不能够直接读出 $ cat .mylogin.cnf $ mysql --login-path=login -s (db)root@localhost [(none)]> 2.修改orzdba 运行:$ vim orzdba #找到160行 gg 160 my $MYSQL = qq{mysql -s --skip-column-names -uroot -P$port }; 修改为 my $MYSQL = qq{mysql --login-path=login -s --skip-column-names }; 保存,大功告成。
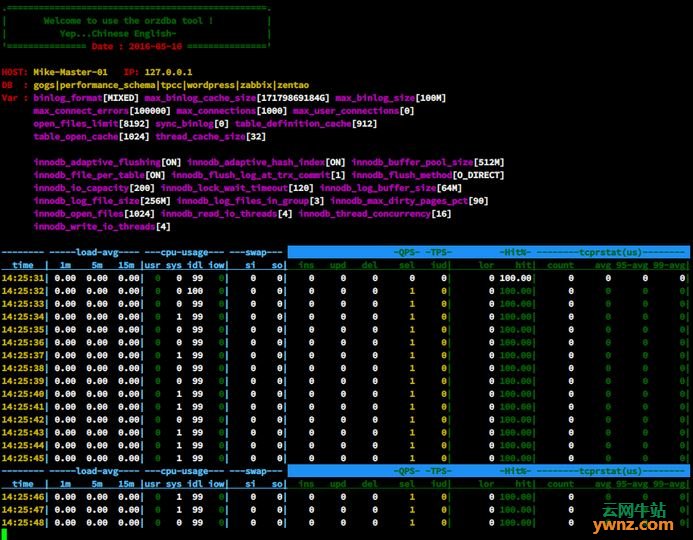
使用 1.使用方法可用帮助命令查看: 运行:$ orzdba -h Info : Created By zhuxu@taobao.com Usage : Command line options : -h,--help Print Help Info. -i,--interval Time(second) Interval. -C,--count Times. -t,--time Print The Current Time. -nocolor Print NO Color. -l,--load Print Load Info. -c,--cpu Print Cpu Info. -s,--swap Print Swap Info. -d,--disk Print Disk Info. -n,--net Print Net Info. -P,--port Port number to use for mysql connection(default 3306). -S,--socket Socket file to use for mysql connection. -com Print MySQL Status(Com_select,Com_insert,Com_update,Com_delete). -hit Print Innodb Hit%. -innodb_rows Print Innodb Rows Status(Innodb_rows_inserted/updated/deleted/read). -innodb_pages Print Innodb Buffer Pool Pages Status(Innodb_buffer_pool_pages_data/free/dirty/flushed) -innodb_data Print Innodb Data Status(Innodb_data_reads/writes/read/written) -innodb_log Print Innodb Log Status(Innodb_os_log_fsyncs/written) -innodb_status Print Innodb Status from Command: 'Show Engine Innodb Status' (history list/ log unflushed/uncheckpointed bytes/ read views/ queries inside/queued) -T,--threads Print Threads Status(Threads_running,Threads_connected,Threads_created,Threads_cached). -rt Print MySQL DB RT(us). -B,--bytes Print Bytes received from/send to MySQL(Bytes_received,Bytes_sent). -mysql Print MySQLInfo (include -t,-com,-hit,-T,-B). -innodb Print InnodbInfo(include -t,-innodb_pages,-innodb_data,-innodb_log,-innodb_status) -sys Print SysInfo (include -t,-l,-c,-s). -lazy Print Info (include -t,-l,-c,-s,-com,-hit). -L,--logfile Print to Logfile. -logfile_by_day One day a logfile,the suffix of logfile is 'yyyy-mm-dd'; and is valid with -L. Sample : shell> nohup ./orzdba -lazy -d sda -C 5 -i 2 -L /tmp/orzdba.log > /dev/null 2>&1 & 2.监控系统和MYSQL各项指标 $ orzdba -lazy -rt -S /var/lib/mysql/mysql.sock
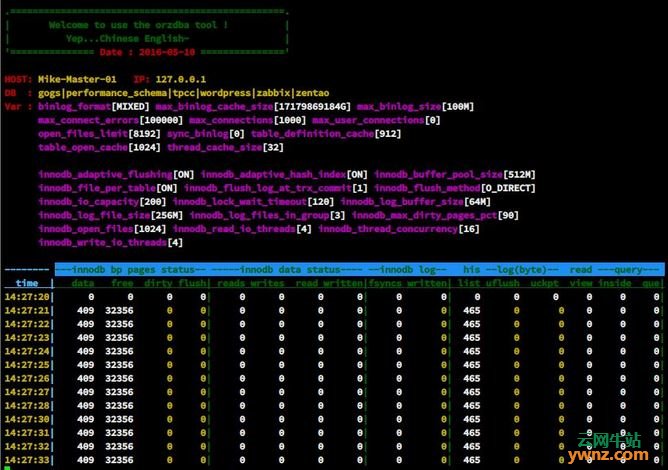
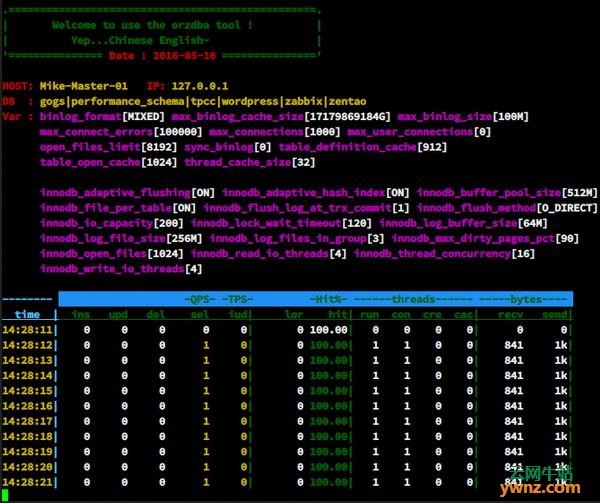
count:此间隔内完成的请求数量 avg:此间隔内所有完成的请求,响应的平均时间 95_avg:此间隔内95%的请求量的平均响应时间(单位微秒),该值较能体现MySQL Server查询的平均响应时间 3.监控InnoDB的各项指标 $ orzdba -innodb -S /var/lib/mysql/mysql.sock 文档中给出[innodb请求命中率]的计算公式为 Hit% = (Innodb_buffer_pool_read_requests - Innodb_buffer_pool_reads) / Innodb_buffer_pool_read_requests * 100% 3.监控MySQL Server性能 $ orzdba -mysql -S /var/lib/mysql/mysql.sock
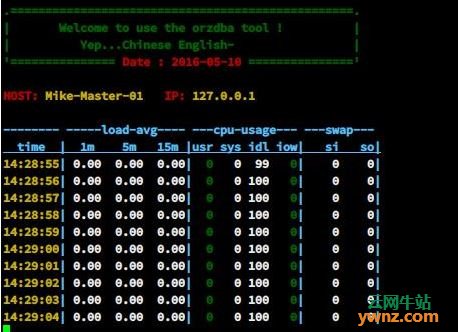
显示出数据库常用变量值、insert/update/delete/select的统计值、innodb请求命中率、线程状态、mysql收发字节数 4.Linux系统信息的监控 $ orzdba -sys
显示出了当前负载状况、CPU使用状况、swap状况 5.查询数据库节点主机cpu,每两秒显示一次,共显示10次,将结果放到cpu.log中 $ orzdba -c -i 2 -C 10 -L cpu.log
相关主题 |